February 27, 2026
We all know LLM evaluation is struggling right now. The benchmarks are saturated, the training data is contaminated, and the vibes are off. That leaves Chatbot Arena as one of the few places left to get a real signal on a model’s capability.
But what if Chatbot Arena has issues as well?
I built an analysis pipeline to decompose 140k human preference battles from Chatbot Arena using logistic regression to find out why models win, and SVD to see how many dimensions human preference actually has. A simple question crept into my mind: is the gold standard of LLM evaluation just a style test?
140k Text Battles
It’s important to clarify up front: Chatbot Arena is a massive platform encompassing many different evaluation modes: coding, computer vision, specialized hard-prompt leaderboards, and more. This analysis focuses exclusively on the core, general text modality.
To run the analysis, we need data.
I grabbed the lmarena-ai/arena-human-preference-140k dataset, which contains 140,000 pairwise text battles of crowdsourced human preferences and set up a two-track analysis pipeline.
Track 1: The Micro (Battle-by-Battle) View For every single battle, I computed the difference between the winner and the loser across 11 basic text features:
- Length & complexity: word count, average sentence length, Flesch-Kincaid grade level
- Formatting: markdown headers, bold text, bullet points, code blocks, numbered lists, paragraph count
- Tone: sycophancy score, hedging score
Then I threw it all into a regularized logistic regression model. Could I predict who won without looking at the actual text meaning, just the style shapes?
Sort of! Across all 98,000 valid battles, style features alone predict the winner with an AUC of 0.656 (McFadden R² = 0.044). That AUC means: pick a random win and a random loss, and the style-only model ranks the winner higher 65.6% of the time. Not overwhelming, but far from chance, and remember, this model has zero access to what the text actually says.
To be honest about what that R² means: ~96% of the variance in human preference is not explained by these style features. Quality clearly matters. But the fact that surface-level formatting alone gets you to 0.656 AUC is still striking.
Word count is the biggest predictor by far, followed by bold text and paragraph structure. Some features push in surprising directions. Bullet count has a slightly negative coefficient, meaning more bullets marginally hurts win probability in the aggregate. And sycophancy score? Statistically insignificant (p = 0.72). Despite all the community discourse around sycophantic models, flattery doesn’t predict Arena wins.
Track 2: The Macro (Decomposition) View I built a matrix of (prompt cluster × model) win rates: 52 models across 4 prompt categories. To see if human preference is driven by just a few underlying factors, I ran a mathematical decomposition (SVD) on this matrix.
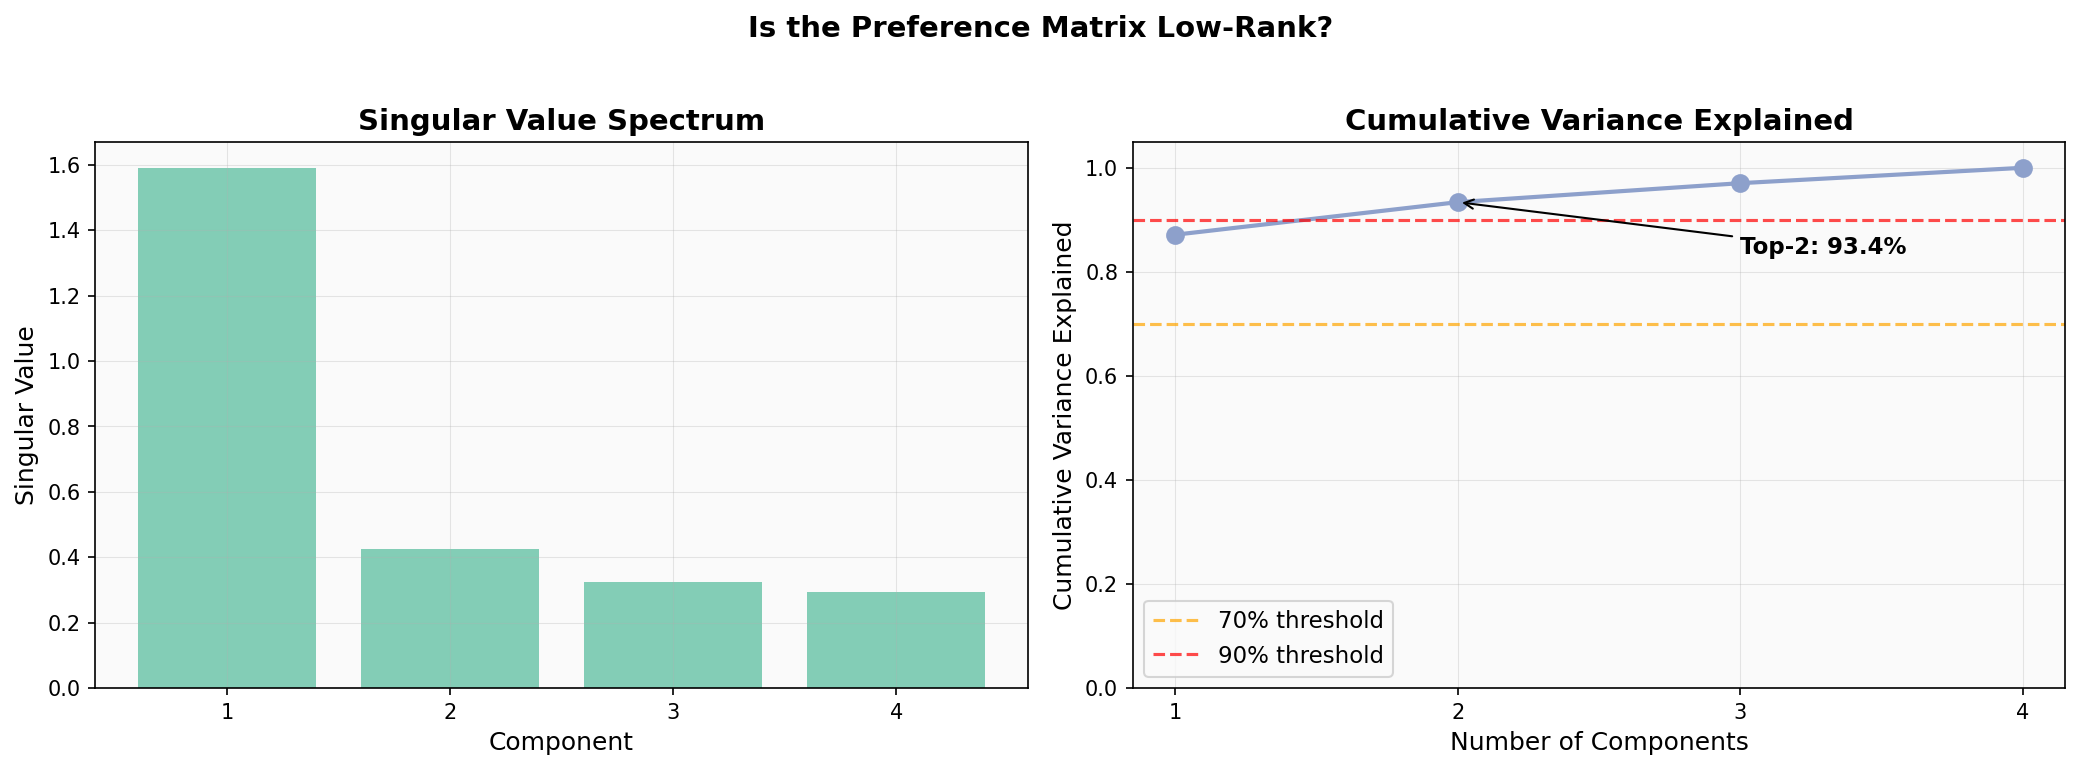
The first component captures 87% of the variance, and the top two capture >93%. An important caveat: with only 4 prompt clusters, the matrix can have at most 4 components, so the concentration is partly a structural artifact of the matrix dimensions. The raw variance numbers shouldn’t be over-interpreted.
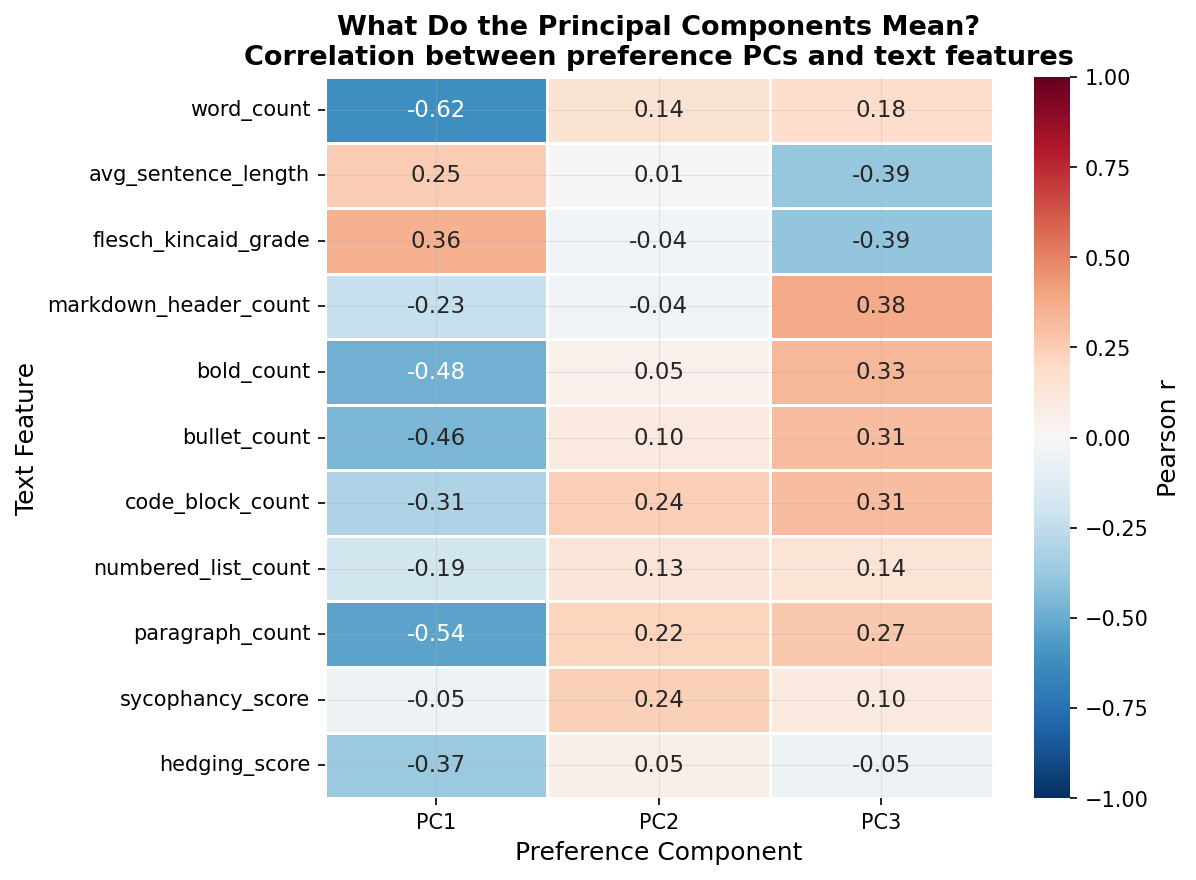
What’s more telling is what these components represent. When I mapped these two preference components against my 11 style features, strong individual correlations emerged: word count correlates at -0.62 with PC1, bold count at -0.48, paragraph count at -0.54. The preference axes load heavily onto stylometric features, though a formal Procrustes alignment test (disparity = 0.80) shows the full 11-feature space doesn’t rotate cleanly onto the 2D preference space. The style signal is real but doesn’t capture the whole picture.
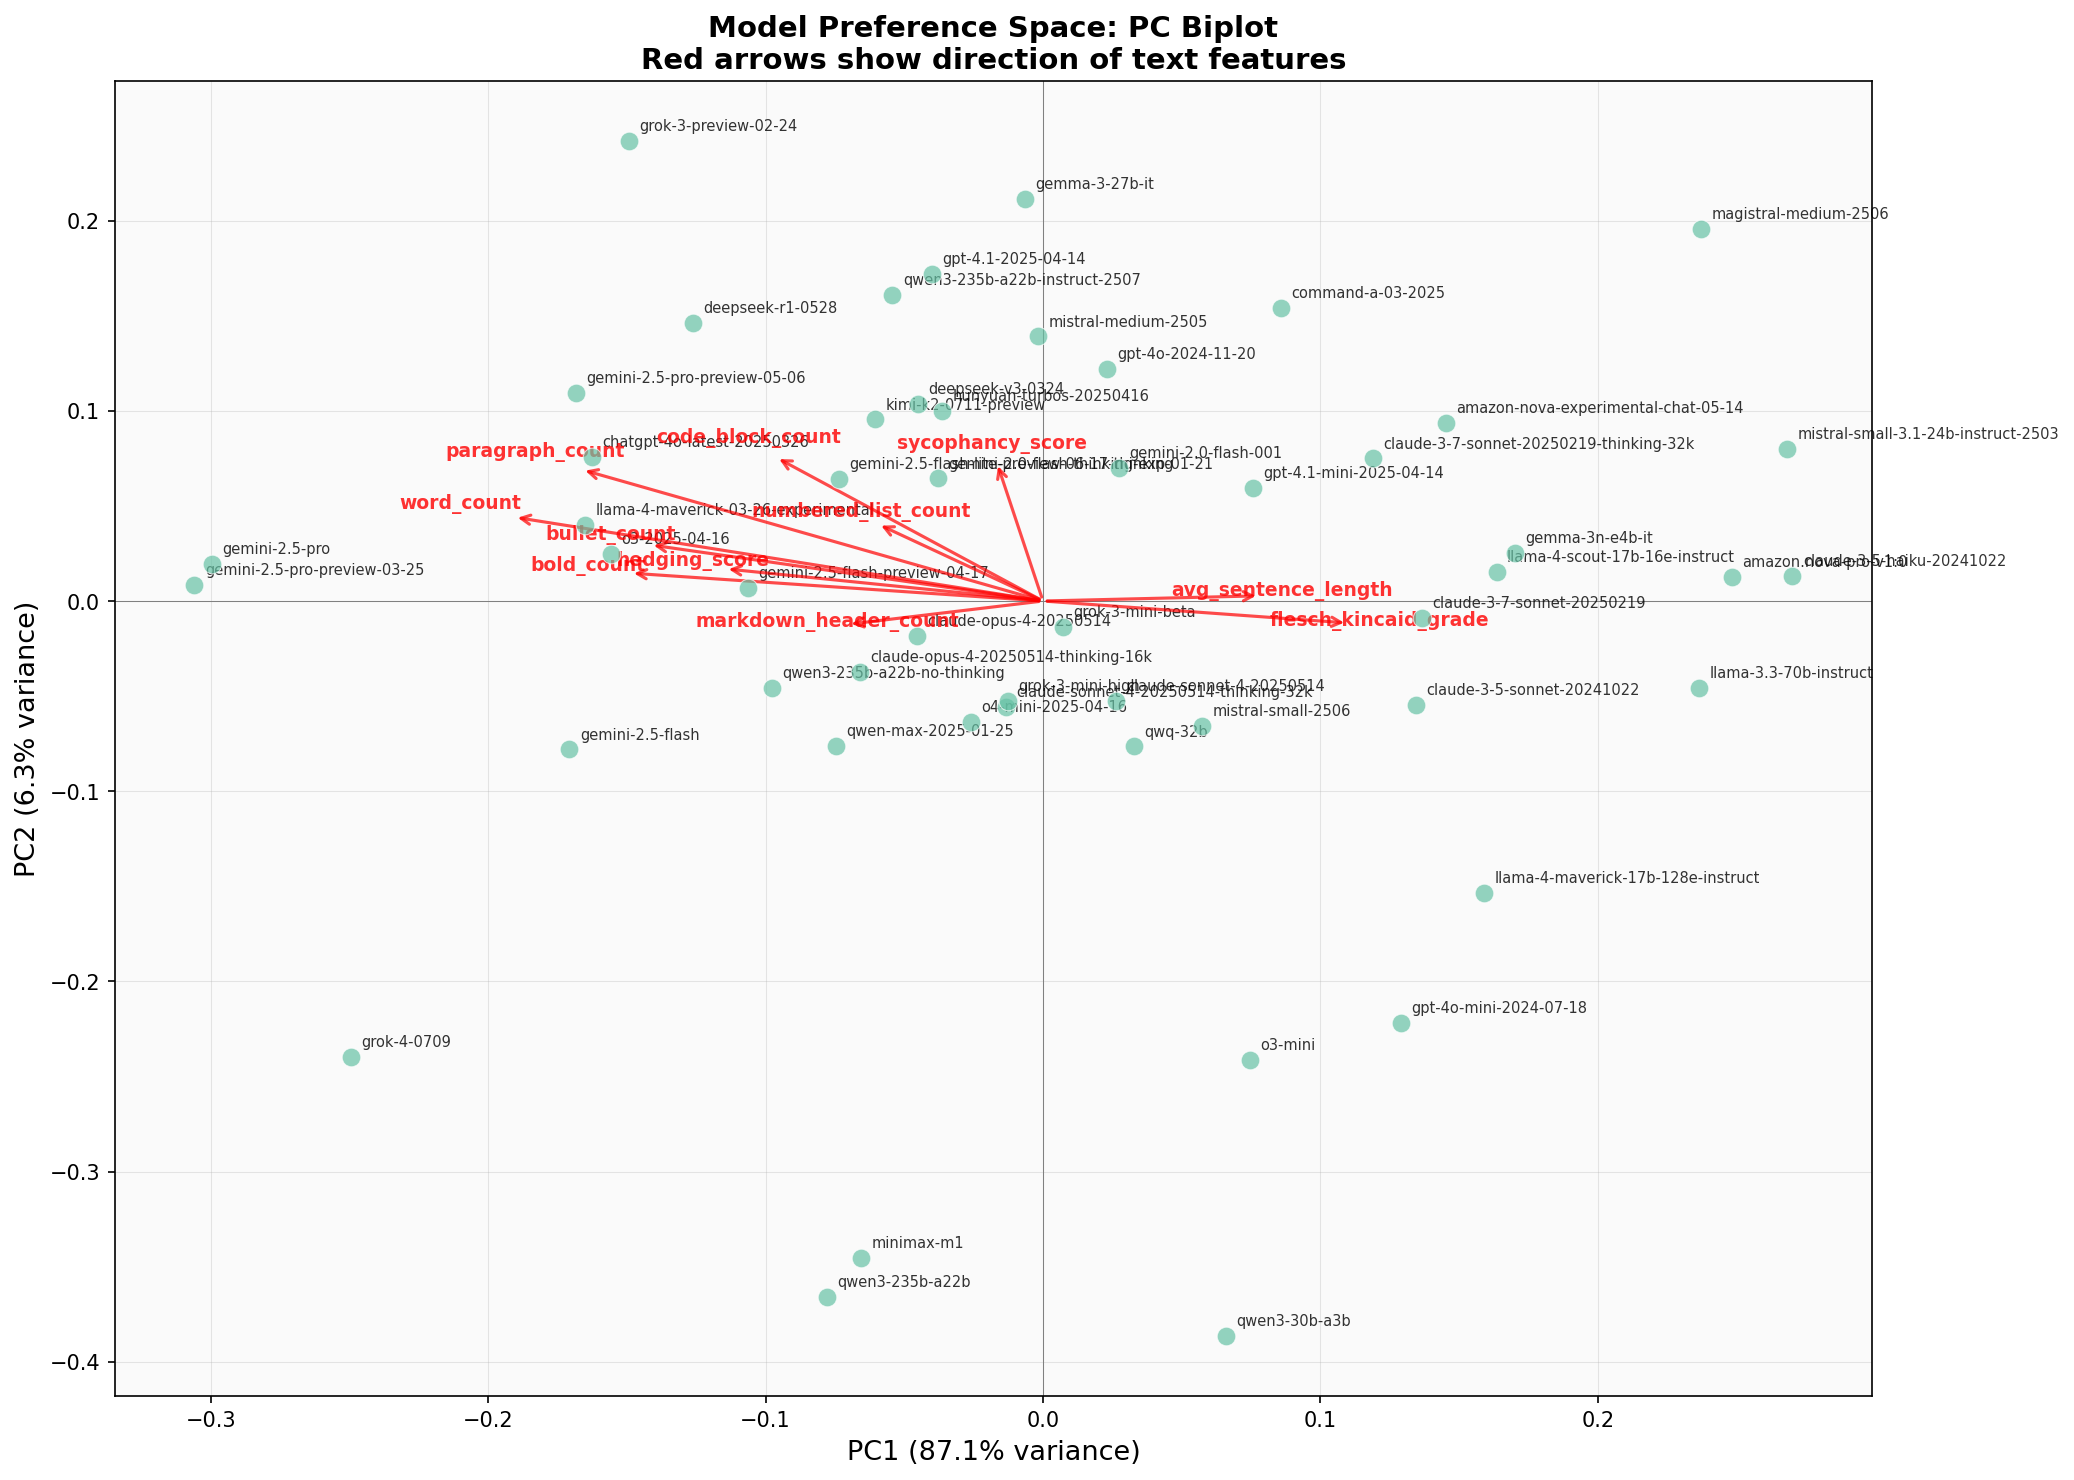
You can see the style features mapped against the models in principal component space. The correlations between individual text features and the preference components are strong:
But wait, there’s an obvious counterargument.
The Quality Confound
“Of course longer answers win,” you might say. “Better models write more detailed answers. Style is just a confound for quality!” This was my biggest reservation too. If GPT-4 is both smarter AND wordier than a 7B model, then word count will artificially look like it’s driving the win, when really it’s the intelligence. The same logic undermines Track 2: if better models produce stylistically distinct text, then the PC-feature correlations might just be capturing quality, not style per se.
So I ran one more experiment: Close Matchup Dynamics. I stratified the battles by the strength gap between the two competing models, using each model’s overall win rate in the dataset as a proxy for strength. I looked at “mismatch” battles (large win-rate gaps, like a frontier model vs a 7B) and “close” battles (models within 5 percentage points of each other).
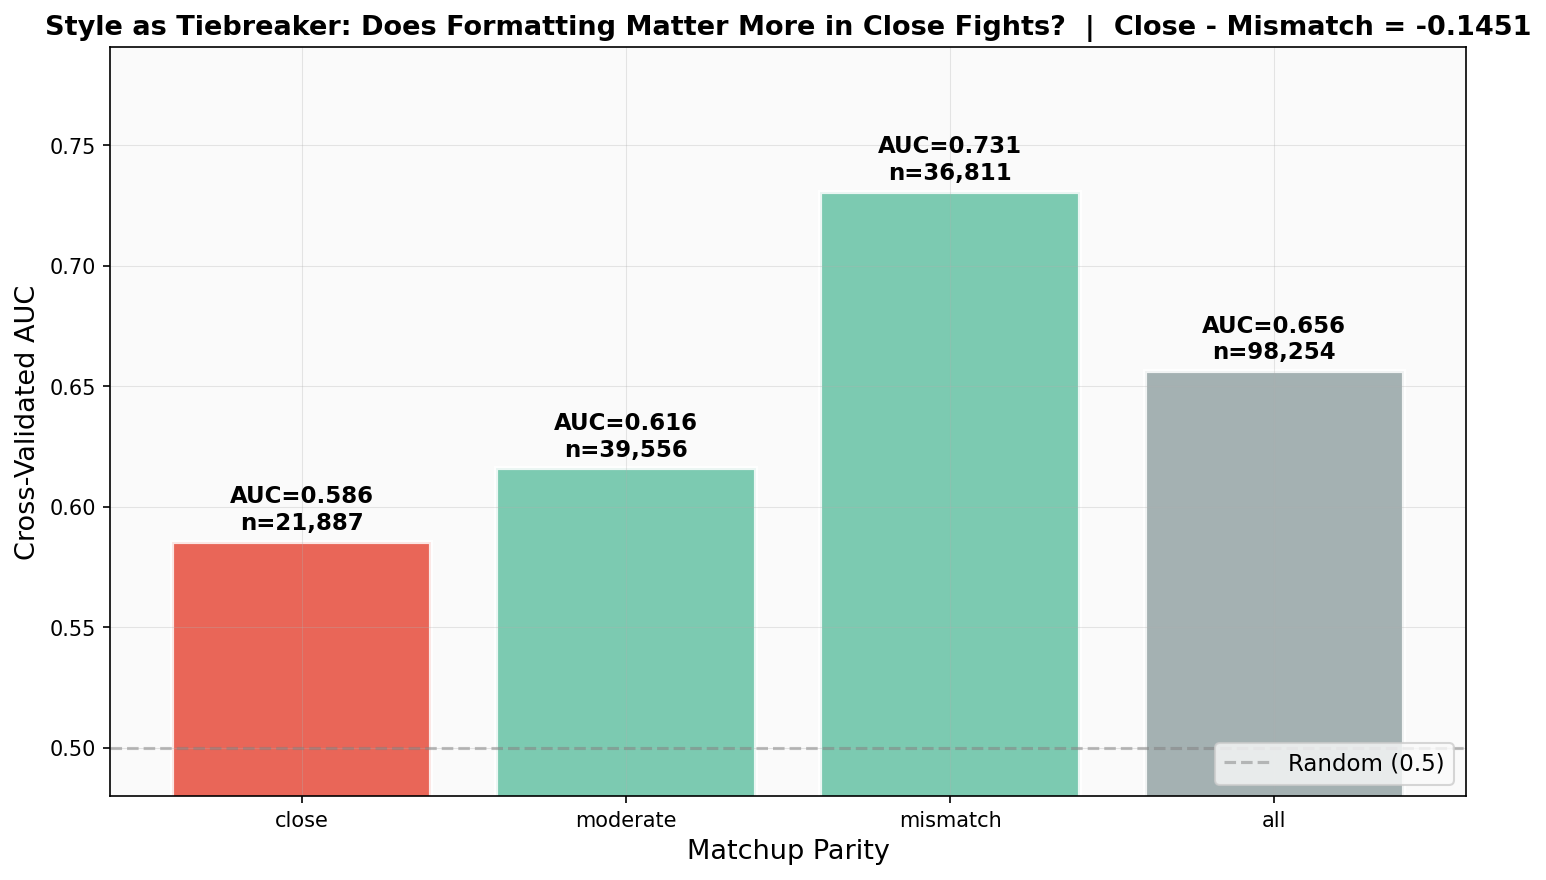
If style is just a proxy for intelligence, then in close battles, where intelligence is roughly equal, style should stop predicting the winner. Here’s what happens:
In mismatched battles, both a model’s baseline identity (its win rate) and its style features predict the winner equally well (AUC ~0.73). In fact, across all battles and in moderate/mismatch strata, identity slightly outperforms style. Knowing which model is fighting is generally more predictive than knowing how it formats.
But in close battles, that flips. The model’s identity AUC plunges to a coin-flip 0.53. It’s too close to call based on just knowing “who” is fighting. What happens to the style AUC? It drops… but only to 0.585.
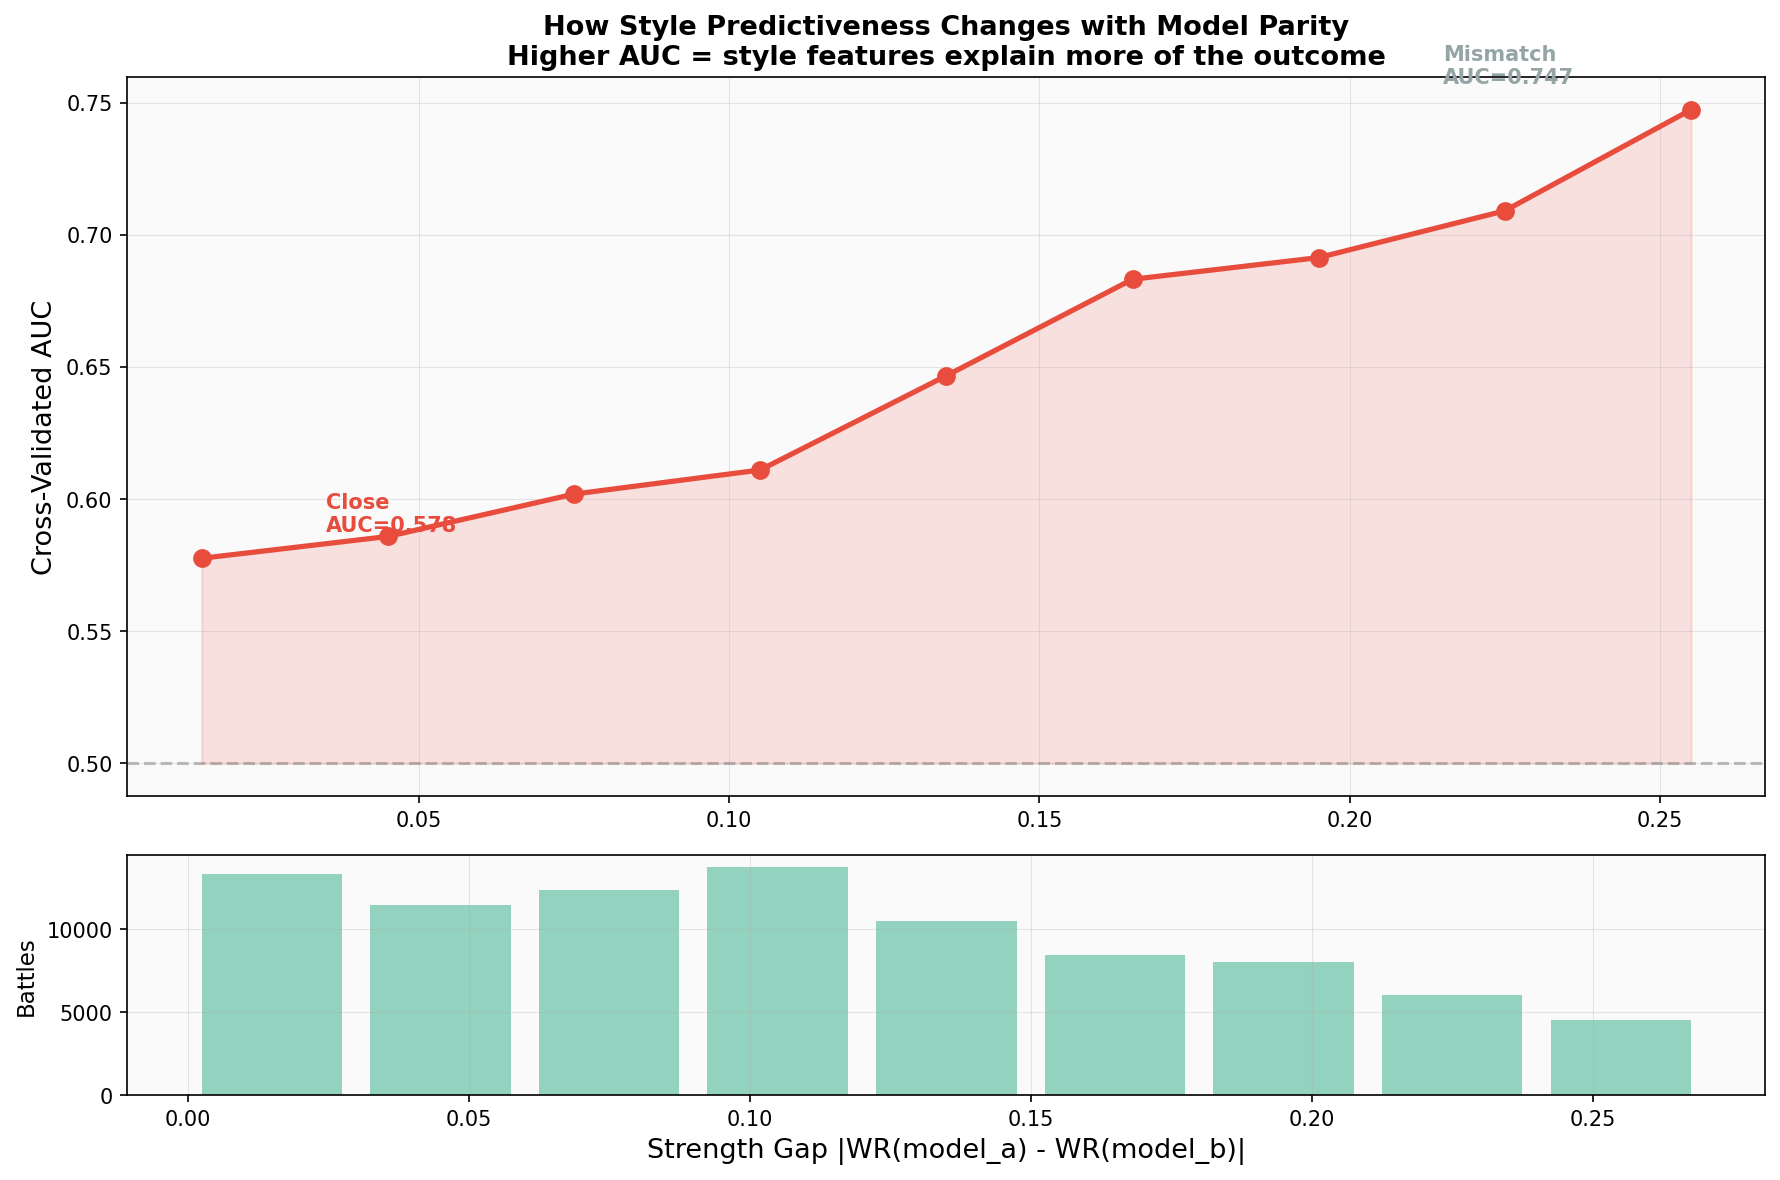
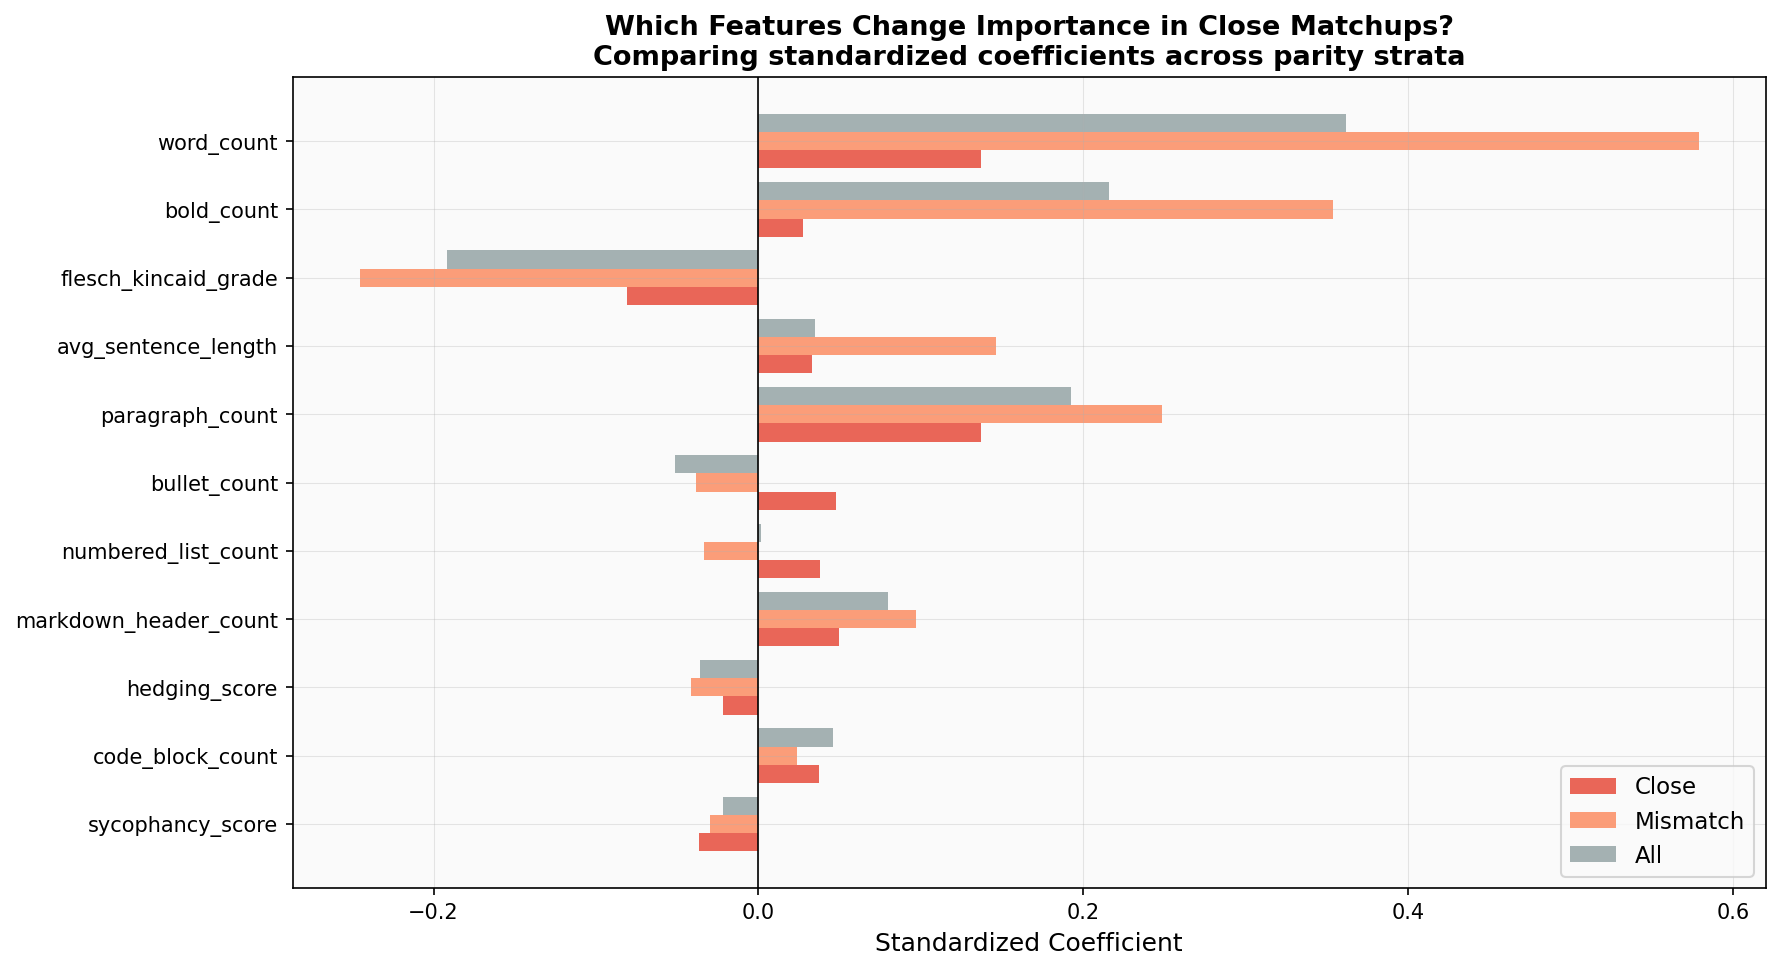
The style AUC declines slower than the identity AUC. Style retains a 5.5-point predictive advantage over baseline model strength when the fight is tight. This is the key finding: style has genuine, residual predictive power independent of base model quality. When two models are evenly matched, the one that formats better wins. And interestingly, in these tight battles, raw word count becomes less important (its coefficient drops 76%, from 0.58 to 0.14), while formatting elements like paragraph structure and bullet points step up as the tiebreakers.
So What Now?
Let’s be clear about what this means. If you put a tiny 7B model up against a frontier model, the smarter model will win. Capabilility is the barrier to entry. But at the cutting edge, top models are becoming functionally indistinguishable in baseline strength. They are all locked in “close matchups.”
And when the models are evenly matched, formatting decides the winner. Chatbot Arena might have started as a pure intelligence test, but at the top of the leaderboard, it has become a beauty pageant.
A few caveats worth keeping in mind: this analysis covers 11 hand-picked text features, and different feature choices could tell a different story. The dataset reflects Arena’s user base, which skews tech-savvy and English-speaking. We can see that formatting predicts wins, but we can’t say voters are consciously choosing based on bullet points. It’s likely a more subtle perceptual effect.
Still, it’s remarkable that we can quantify this bias so precisely with just surface-level text features. As models increasingly do work for other models, measuring how well an LLM formats its output for a human reader might become the least important metric of all.
If you want to explore this idea further, check out the full code here: